This article rounds up 8 log file analysis tools, from simple viewers to more advanced analyzers, to help you choose one that fits your workflow.
Today, businesses must manage and analyse an overwhelming amount of log data.
A survey by Chronosphere found that 22% of organizations generate 1 TB or more of log data daily, with 12% producing over 10 TB daily.
Whether you’re tracking down errors, monitoring performance, or investigating incidents, having the right tools to analyze log data generated at this scale is no easy task, especially if you’re trying to do it manually.
The challenge isn’t just volume. Logs come in different formats, span multiple systems, and can be difficult to search or interpret without the right tools.
Log file analysis tools make this process faster and more effective. They help you extract what matters, spot patterns, and monitor systems in real time.
But not all tools do the same job. A developer debugging an application doesn’t need the same features as an SEO manager analyzing crawl errors.
What’s the Difference Between Log File Analysis and Log Analysis Tools?
These two types of tools often get confused. However, there are subtle differences:
Log file analysis tools help you open and inspect individual log files, usually for troubleshooting or debugging. They are used by developers, sysadmins, and IT teams reviewing logs on a single machine or a small set of servers.
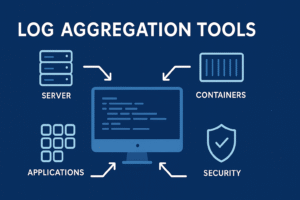
Log analysis tools are more advanced. They collect and centralize logs across systems, store them long-term, and provide tools to search, correlate, alert, report, and visualize log data.
While they’re commonly used in cybersecurity for threat detection and compliance, they’re also essential in IT operations, helping teams monitor performance, reduce downtime, and understand system behavior at scale.
8 Best Log File Analysis Tools
Now you know what log file analysis tools are, let’s look at 8 worth consideration. For each, we’ve aimed to explain what it does, why it’s good, and who it suits.
Some are lightweight or suited to specialized uses, while others are enterprise-grade with broad application. We recommend reading through all of them to find one that suits your needs.
| Tool | Use Case | Best For |
| Logmanager | Scalable, supported log analysis for growing teams | Mid-sized to large IT teams needing centralized visibility |
| GoAccess | Real-time web server log summaries in the terminal | Admins monitoring Apache/Nginx traffic quickly |
| BareTail | Live log watching for Windows, no setup needed | Developers debugging on Windows |
| Notepad++ | Manual inspection and editing of log files | Quick spot-checks by developers/sysadmins |
| grep + tail | CLI tools for real-time log filtering and search | Linux/Unix users needing fast, scriptable tools |
| Apache Logs Viewer | Visual interface for Apache log inspection | Admins managing standalone Apache servers |
| LogExpert | Advanced Windows log viewer with search and tabs | Windows users inspecting large/complex logs |
| Glogg | High-speed viewer for large logs on all platforms | Post-incident debugging on Linux, Windows, macOS |
1. Logmanager
Best for scalable, supported log file analysis across your business

Logmanager is a centralized log management platform designed to help businesses collect, analyze, and retain logs from across their infrastructure.
It suits smaller businesses that want to move beyond using manual methods to analyze log data while still keeping things simple.
It does this by removing the usual setup complexity. Logmanager offers 140+ built-in parsers for common technologies like firewalls, networking, EDR, etc, and users can also leverage connectors for Windows, SQL, Microsoft 365, and Linux, supporting formats such as CEF, LEEF, and JSON, so they get a single platform and can start analyzing files right away.
Logmanager supports on-premise deployment via virtual appliances for VMware and Hyper-V, with full technical support. Users often cite that support as a key differentiator, especially for IT teams that don’t have the time or resources to configure and manage complex log infrastructure.
Key features:
- Real-time log file monitoring
- Available as a virtual appliance for VMWare ESXi and Microsoft Hyper-V
- Advanced filtering and full-text search with natural language
- Consistent data normalization, indexing, and customizable tagging of log data
- Out-of-the-box dashboards for audit and compliance
- Centralized Windows event log monitoring
Pros:
- Free trial available
- Easy to deploy and scale
- Includes detailed guides supporting onboarding
- Easy customization via Blockly
- Combines SIEM-level features with usability
Best for:
- Mid-sized companies and enterprises
- IT teams that want a fully supported log file analysis tool
- Businesses moving away from manual tools like grep and Notepad++
2. GoAccess
Best for real-time web server log analysis
Designed for speed and simplicity, GoAccess is an open-source log file analyzer specifically built for web server logs. It runs in a terminal or browser and provides real-time, visual summaries of access logs from servers like Apache, Nginx, and AWS ELB.
GoAccess can be installed on most Linux systems with a single command. Once configured, it parses log files and displays dashboards that track traffic volume, visitor IPs, HTTP status codes, referrers, and more.
It’s ideal for sysadmins and DevOps teams who want fast insight into server activity without spinning up a full observability stack.
Key features:
- Real-time analysis of access logs
- Interactive terminal dashboard or web UI
- Support for common log formats
- Minimal setup: No database required
- HTML reports for sharing insights
Pros:
- Fast and lightweight
- Real-time summaries of key traffic data
- Easy to install and run on most systems
- No need for a separate backend
Cons:
- Limited to web server log types
- Not suitable for multi-source or centralized logging
- No long-term storage or advanced alerting
Best for:
- Admins monitoring Apache or Nginx logs
- DevOps teams needing quick visibility into traffic
- Anyone wanting a free, real-time alternative to commercial tools
3. BareTail
Best for real-time log viewing on Windows
BareTail is a real-time log file viewer for Windows that offers a fast, no-frills way to monitor log updates as they happen.
It’s especially useful for developers and sysadmins who want to watch logs update in real time, just like the tail -f command on Unix systems, but in a Windows-friendly interface.
BareTail requires no installation, just download the executable, open your log file, and it starts displaying new entries in real time.
From there, you can highlight patterns with regex, bookmark important lines, and monitor multiple files at once from a single window.
It’s particularly popular for tasks like debugging during development or testing, where a lightweight viewer is faster and simpler than deploying a full log management system.
Key features:
- Real-time log tailing with instant refresh
- Regex-based highlighting and filtering
- Support for very large log files
- Configurable font, wrap, and display settings
- No installation required
Pros:
- Simple and fast to use
- Handles large files well
- Ideal for live log watching
- Great option for Windows users
Cons:
- Windows-only
- No log search history or advanced reporting
- Limited to viewing, no analysis features
Best for:
- Windows developers debugging apps or services
- Small teams monitoring application or system logs
- Anyone needing a quick way to live-tail logs without setup overhead
4. Notepad++
Best for quick inspection and editing of log files
Notepad++ is a popular open-source text editor for Windows. It is widely used by developers and sysadmins to view and edit everything from config files to raw logs.
It’s not a dedicated log analysis tool. But it is ideal for quick inspections, especially when logs are small or only require light filtering.
Notepad++ is useful for log file analysis because it can open large files without crashing, lets you color-code parts of the text to make logs easier to read, and has a powerful search tool that helps you quickly find specific errors or patterns.
With the right plugins, users can also compare log files side by side or collapse sections to navigate complex logs more easily.
Key features:
- Fast, lightweight text editing
- Regex-based find and replace
- Syntax highlighting and line numbering
- Tabbed interface for multi-file workflows
- Plugin support for extended functionality
Pros:
- Free and highly customizable
- Handles large files better than many standard editors
- Excellent for manual inspection and pattern matching
- No setup, just open and go
Cons:
- Not built specifically for log analysis
- No real-time monitoring or dashboards
- Windows only
Best for:
- Developers and sysadmins reviewing log output
- Quick spot-checks or error tracing
- Anyone who needs a fast way to open and scan plain text log files
5. grep + tail
Best for command-line filtering and real-time viewing
On systems like Linux or macOS, grep and tail are built-in tools that let you view logs in real time and search for specific entries directly from the command line.
Lightweight, powerful, and available by default on most Unix-like systems, they let users search, filter, and monitor logs without any extra software.
tail -f allows you to view new log entries as they’re written, which is especially useful for real-time monitoring.
Grep, on the other hand, enables you to zero in on specific keywords, error codes, IP addresses, or timestamp patterns. This makes it ideal for quickly filtering large logs.
While they lack the visual polish of platforms with a graphical user interface (GUI), these tools are fast, scriptable, and highly flexible.
Key features:
- Real-time log viewing with tail
- Pattern matching and filtering with grep
- Combine with awk, sed, or pipes for more advanced parsing
- Works over SSH for remote log access
- Available by default on most Linux/macOS systems
Pros:
- No installation needed on Unix systems
- Extremely fast and lightweight
- Can be automated or scripted for repeated tasks
- Works well for targeted log investigation
Cons:
- Steep learning curve for new users
- No UI, dashboards, or alerting
- Not ideal for multi-source log analysis
Best for:
- Linux admins and DevOps engineers
- Live troubleshooting over SSH
- Parsing logs in development, staging, or production environments
6. Apache Logs Viewer
Best for visualizing and filtering Apache log files
Apache Logs Viewer (ALV) is a Windows-based desktop tool designed for analyzing and visualizing Apache HTTP server logs.
It has a user-friendly visual interface that lets you scroll through large log files, apply filters with dropdowns and checkboxes, and spot key patterns or errors, all without using the command line.
This makes it ideal for users who want to analyze Apache logs through a visual interface without writing scripts or working in the terminal.
The tool supports standard Apache log formats and lets users group requests by IP address, URL, status code, or user agent. It also offers basic traffic statistics and error reporting, which can be useful for troubleshooting and performance checks.
ALV is a good choice for system admins or developers who manage Apache servers. However, if you have broader requirements, then you may need to supplement it or choose a general-purpose log analysis software platform.
Key features:
- GUI-based log browsing and filtering
- Support for common Apache log formats
- Error tracking and traffic stats
- Export reports to CSV or HTML
- IP geolocation and user agent analysis
Pros:
- Clear, interactive interface for non-technical users
- Easier to explore patterns than using plain text tools
- Good for historical log analysis and quick reporting
Cons:
- Windows-only
- Limited to Apache logs, no support for Nginx, IIS, etc.
- Not suitable for real-time or centralized analysis
Best for:
- Admins managing standalone Apache servers
- Users who want a point-and-click interface for log review
- Generating basic usage and error reports without scripting
7. LogExpert
Best for advanced log file viewing on Windows
LogExpert is a free, open-source log viewer for Windows that offers a more advanced alternative to tools like BareTail.
LogExpert does this by offering more control and customization. You can set up regex-based search, apply highlighting rules to spot important events, add bookmarks for quick navigation, and open multiple files in tabs.
It also supports real-time updates, so you can leave it open and watch as new log data comes in.
However, LogExpert’s biggest selling point is its ability to handle very large log files. These logs usually overwhelm basic text editors and cause them to crash.
It does this by streaming the log data rather than loading the entire file into memory. This makes it far more stable and responsive.
It’s built for developers and sysadmins who work with large log data files and need real-time monitoring, highlighting, and filtering. It has more features and flexibility than a basic tail tool.In other words, if BareTail is good for quick, one-off log viewing, LogExpert is better suited to longer sessions where you need to dig through complex files, filter out noise, or follow specific patterns.
It’s a great middle ground between lightweight tools and heavier log management software.
Key features:
- Real-time log tailing and file polling
- Regex search and highlighting
- Tabbed interface with bookmarking
- Plugins for added functionality
- Supports large files with fast performance
Pros:
- More feature-rich than basic viewers like BareTail
- Easy to filter, search, and navigate logs
- Plugin architecture adds flexibility
- Open-source and free
Cons:
- Windows only
- No built-in log correlation or analytics
- Plugins can require configuration
Best for:
- Windows users needing deeper log inspection
- Developers debugging multi-threaded applications
- Teams that want a balance of speed and control
8. Glogg
Best for fast viewing of large log files on Linux and Windows
Glogg is a multi-platform log file viewer designed for speed and performance, especially when dealing with very large log files. Unlike general-purpose text editors, Glogg is built to open and search gigabyte-sized files without freezing or slowing down.
It provides a simple GUI with search functionality that supports regular expressions and highlights live results. You can quickly move from one matching result to the next with a single click or keyboard shortcut and follow multiple log streams at once.
While it doesn’t offer real-time tailing, it excels at post-event log investigation. This makes it ideal for debugging application crashes or reviewing logs after deployment.
Glogg is open-source and runs on Linux, Windows, and macOS.
Key features:
- High-speed navigation of large files
- Regex-based search with instant highlighting
- Jump-to-result navigation pane
- Cross-platform support (Windows, Linux, macOS)
- Read-only view to prevent accidental edits
Pros:
- Handles massive logs quickly and reliably
- Great for retrospective log analysis
- Clean, intuitive interface
- Free and open-source
Cons:
- No real-time tailing
- No filtering or correlation features
- Basic compared to full log analysis suites
Best for:
- Developers reviewing large application logs
- Engineers investigating post-incident files
- Users on Linux or macOS needing a fast, reliable viewer
Simplify Log File Analysis with Logmanager
Whether you’re reviewing individual logs or scaling up to monitor files across your infrastructure, the right tool depends on how much visibility and control you need.
While lightweight viewers are ideal for quick checks, they fall short when logs get complex or security and compliance come into play.
Logmanager bridges that gap. It brings together real-time monitoring, fast search, and built-in support in one platform, so you can move from just reading log files to actually understanding what’s happening across your systems.If you’re ready to save time, reduce noise, and take control of your logs, book a demo with Logmanager to see how it works. Or you can sign up for a free trial and try it out for yourself.


